Lightstone is slightly different to TPN because it gives you information about comparable property sales. TPN is more focused on giving you rental information, default rates, rental escalations, etc. What Lightstone is really good at is giving you realistic comparable property sales. LightStone is a very handy tool to have, especially when looking at investing in flips and doing cash transactions where you’re buying for a R1million, adding about R300 000 in renovations, selling for R1.6million and you’re in and out of the deal within 6-12 months.
Let me take you through an example of an actual report and how to use it to do due diligence on a potential investment property.
Comparable Properties
Firstly, when you download a report, you will get a map image and the X will show you where the property you’re researching is located in proximity to recently sold properties.
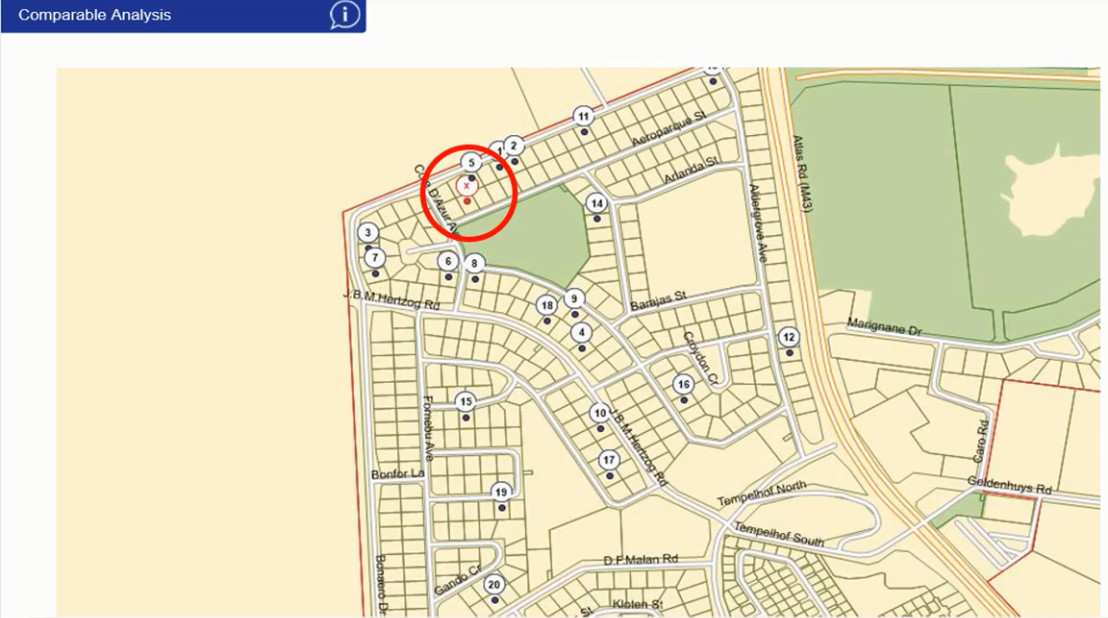
You can see the size of the stand and visually that 11, 2, 1, 5 and property X are relatively the same size. Number six looks a little bit wider and number 12 seems to be a little bit thinner. This gives you an indication of the stand sizes in the area and how they are valued.
If you go down, you’ll see the actual list of properties that have been sold.
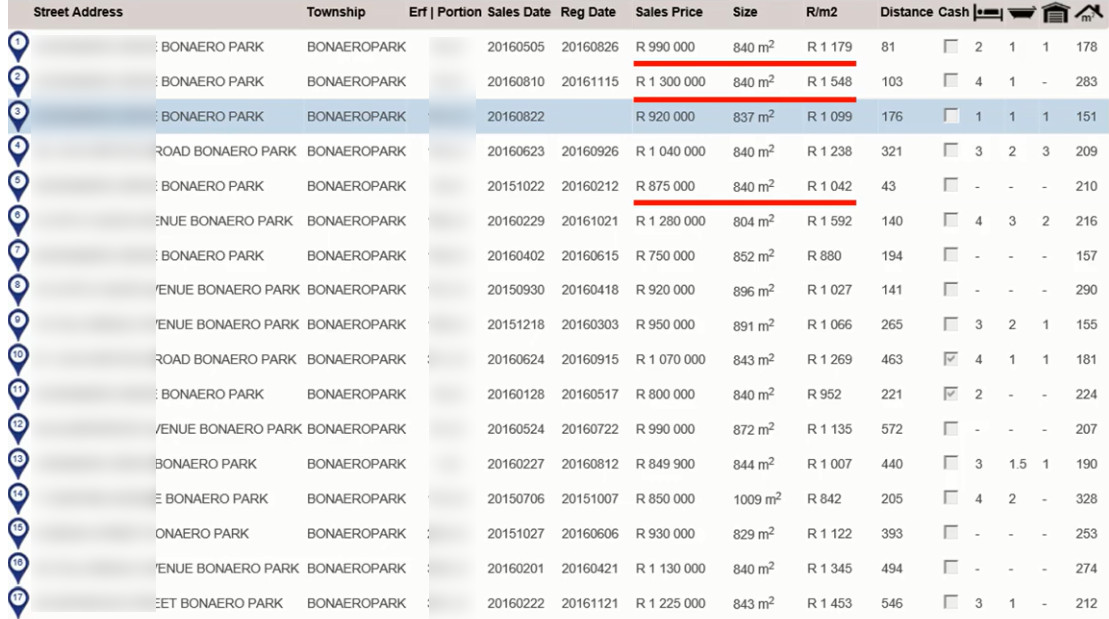
The reason why this is so powerful is that sometimes when you’re trying to determine a resale value using Property24 or Private Property, you’re going to get stuck because the averages from these websites are not going to show a realistic resale value. Reason being most estate agents don’t put the realistic value – they put a value they are willing to negotiate down.
For example, I was looking at a block of flats a while ago and it was on the market for R1.8million on Property24. We ended up closing that deal at R1.45million. So, there was quite a large room for negotiation that the estate agent was willing to do. That’s why I really like LightStone because it tells you what the actual resale value is.
You can also see the sales date and the registration date. (note: the properties in the example report are dated 2015-2016 because I pulled the report at that stage.)
The way that I like to work out what my property will be worth is by using an average per square meter calculation. Look at the list again and you’ll see that property number one is going for R1 179 per square meter. Number two is going for R1 548 per square meter and number five is going for R1 042 per square meter.
Take those three numbers, divide them by three and you’ll get an average rand per square meter for that area.
(R1 179 + R1 548 + R1 042) = R3 769/3 = R1 256 average price per square meter.
Multiply that rand per square meter with your current property size. For property X, the land is registered at 872 square meters (shown in the Property Details section of the report.)
R1 256 x R 872 = R1 095 232 sales price for Property X
Lastly, I discount that by 10% because I’m going to sell quickly if all the properties in the market are selling for R1m or more.
R1 095 232 x 90% = R 985 709
Compare that to the last sales price highlighted below.
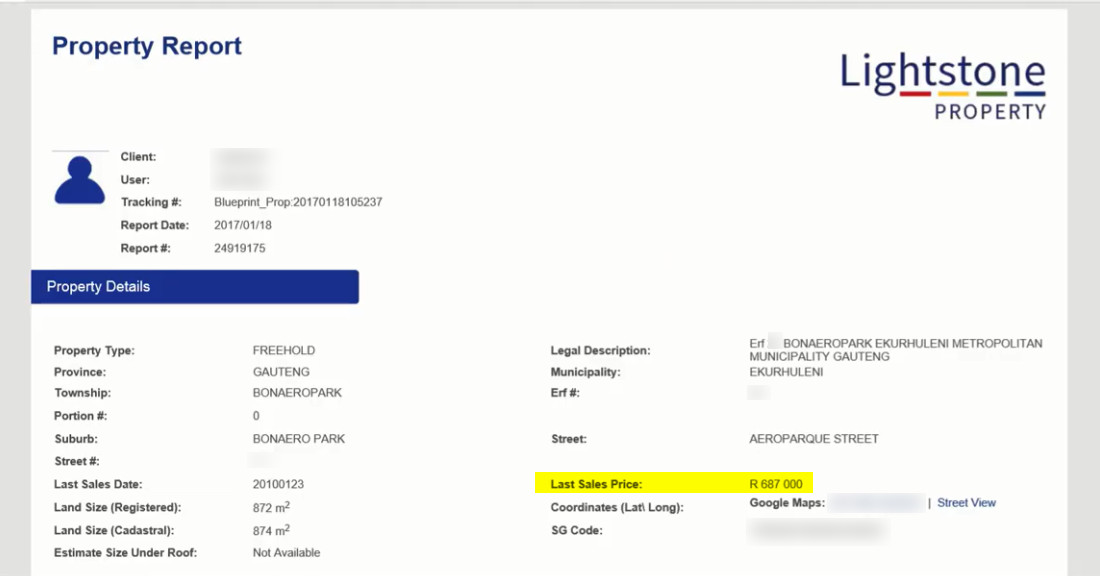
You can see that there’s a lot of equity in this deal. I mean, if the current owner bought it for R687 000, that means we could purchase it at the same price if the circumstances were right and have enough fat in the deal to be able to make some money.
To determine how much money you could make on Property X, look at the capital appreciation section of the report. The green bars are your sectional title schemes, your blue is your freehold and the dark blue purple is vacant land.
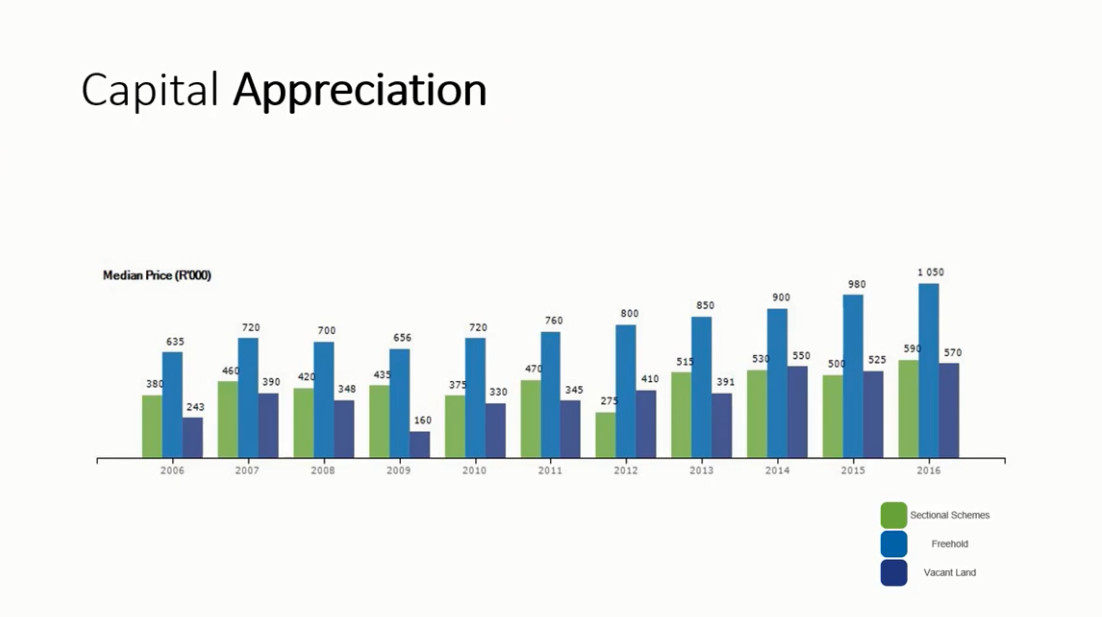
From 2009 all the way through 2016, you can see that freehold property values in this area have consistently gone up from R656k to R1m on average. The capital appreciation from 2009 to 2016 was 7.5% on average. Let me show you how to work that out.
Take the 2009 property value and subtract it from 2016 property value.
R1 050 000 – R656 000 = R394 000
That means that from the period of 2009 to 2016, the property prices increased by R394 000 on average. Divide that by your starting off point in 2009, and you’ll see that there has been a 60 percent growth.
R394 000 / R656 000 = 0.6×100 = 60% total growth over the period
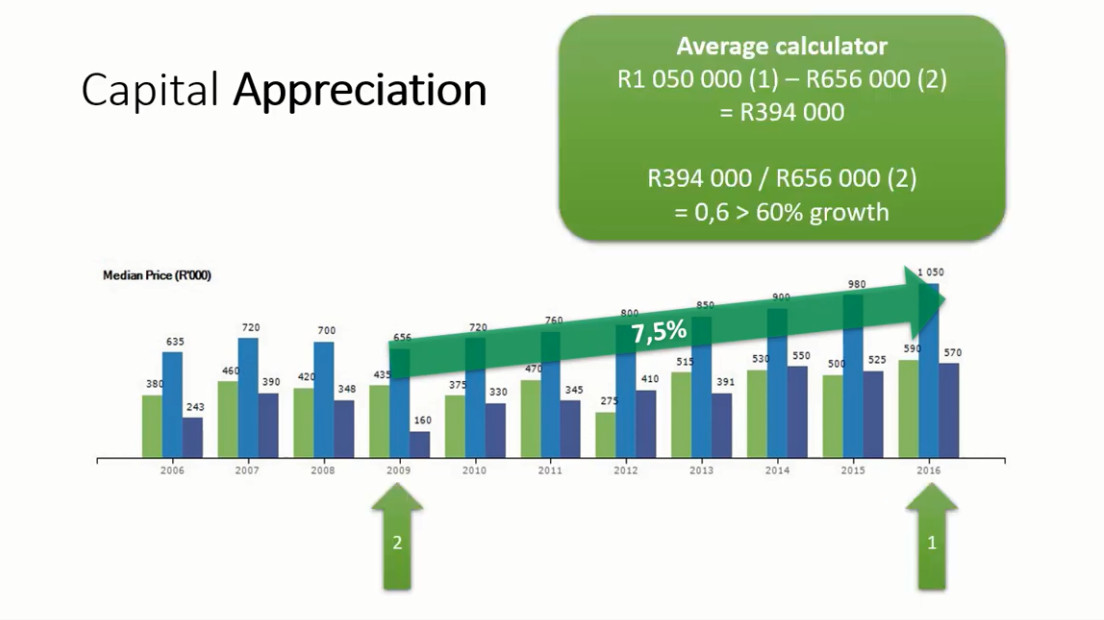
So, freehold property has gone up 60% between 2009 and 2016. Now this has been over a period of eight years. So again, take that 60 percent growth, divide by eight years and you get 7.5% per annum growth rate.
60/8 = 7.5% property value growth per annum
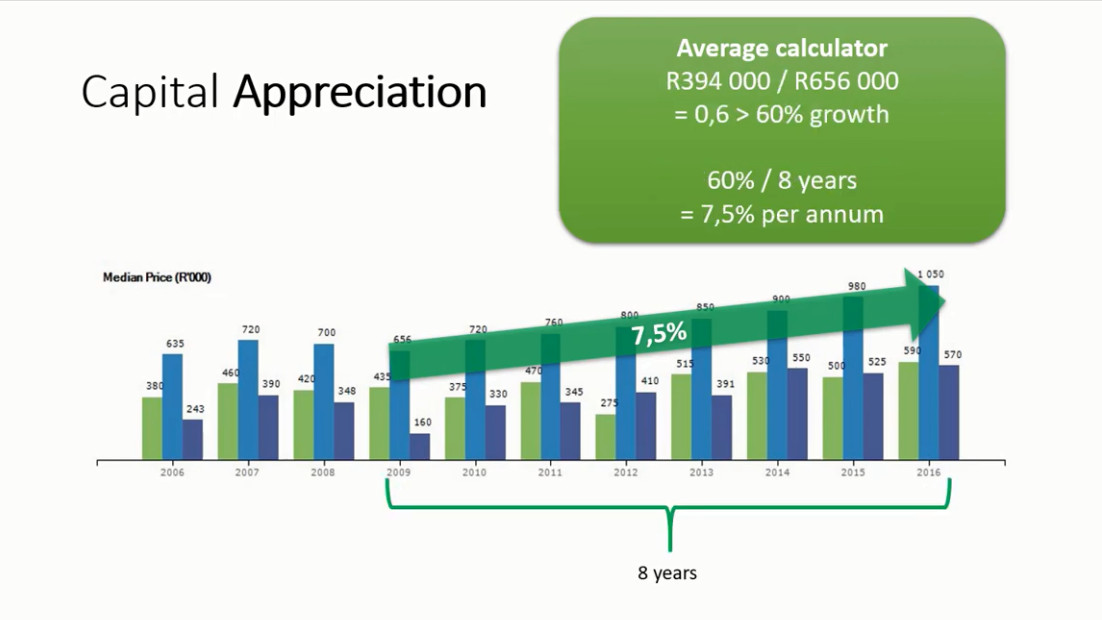
This calculation is not 100% perfect, but it will give you some sort of estimation as to what growth could be in 2017, 2018 and 2019.
Lastly, let me just take you through some of the sections of the report so that you can really understand the value of LightStone if you want to get it.
The report we’ll be looking at is from the Property X example I’ve just taken you through.
Property Details
First you’re going to see the property details section.

The last sales price is very important because it helps you determine what the lowest amount the seller would be willing to sell at.
The legal description helps you verify you’re looking at the correct property because sometimes the street number is wrong.
Owner Details
The owner’s details section is also quite helpful.

When you are actually logged in to Lightstone, there will be a button here that says easy contact. If you click that, you will get the contact details of the owner for a small fee (less than R20 last I checked).
Owner’s details are particularly important when you’re doing auctioned properties because with an auction, the best way to make money in auction is to get to the person before the actual auction happens.
If I can call the owner and discuss a purchase price before going to auction, I’m most likely going to get a much better price than I will at auction because the auctioneers are trying to push the purchase price up.
Map View
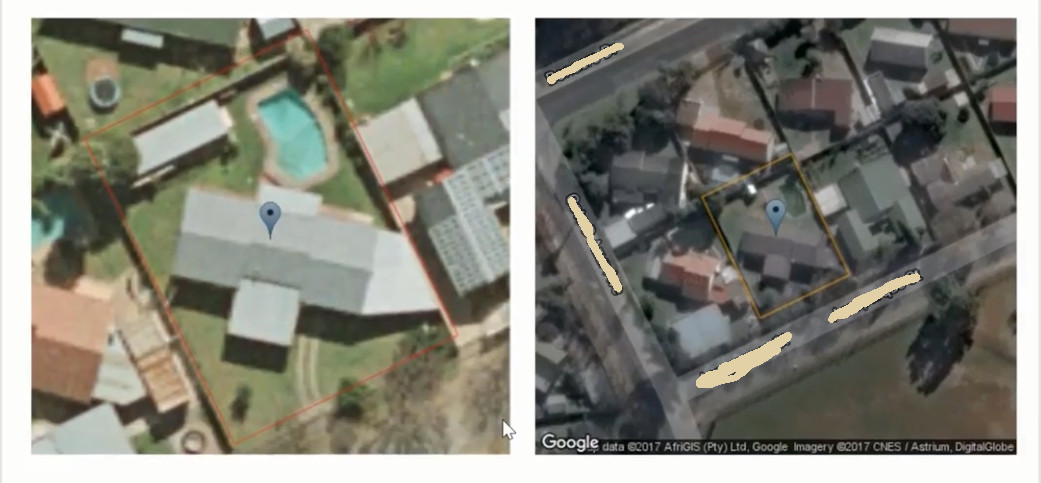
Here’s a picture of the property, so you can just see a quick Google Maps view of it. You can use this to get a real sense of the map that shows you sold properties in close proximity and have a similar size.
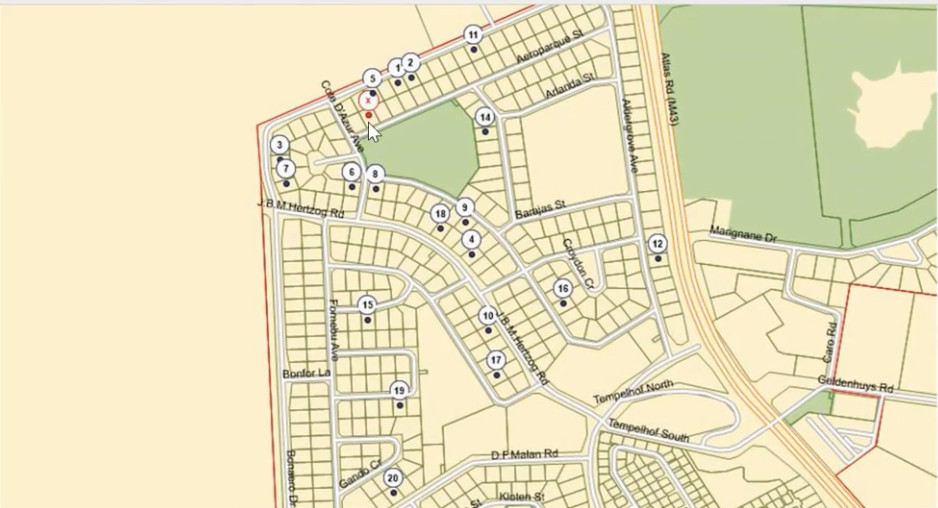
But remember, these are properties all over the spectrum. This isn’t necessarily close or within proximity of your specific property because, as you know, some streets are much more valuable than other streets.
Municipal Valuation
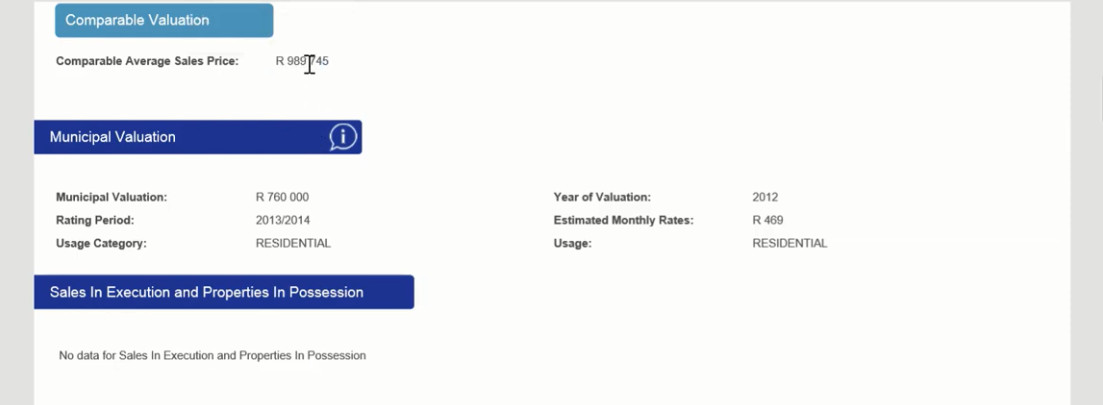
This report was pulled in 2017. The municipal valuation was in 2012. Unless the year of valuation is relatively close to the year that you pulled this report, this number is not really relevant. If this number is particularly low, I’ll phone the estate agent and tell them I’ve pulled the property’s LightStone report. I’ll tell them I noticed that the property’s municipal valuation is only R760 000 whereas the asking price is R1million. this helps me anchor a lower price and try justify why I’m coming in a bit lower than what they’re expecting.
Bond Details

This is a very important section because you can see which bank gave them a bond and for how much. Based on this, you can then work backwards to roughly determine how much this person owes on their bond.

